If you want your website to grow, you need to know what’s working and what’s not. That’s where Google Analytics comes in. It’s a free tool that helps you track your website traffic, understand your audience, and measure what’s driving results. In this guide, I’ll walk you through how to set up Google Analytics, track performance, and read your reports, even if you’ve never used analytics before.
Step 1: What Is Google Analytics?
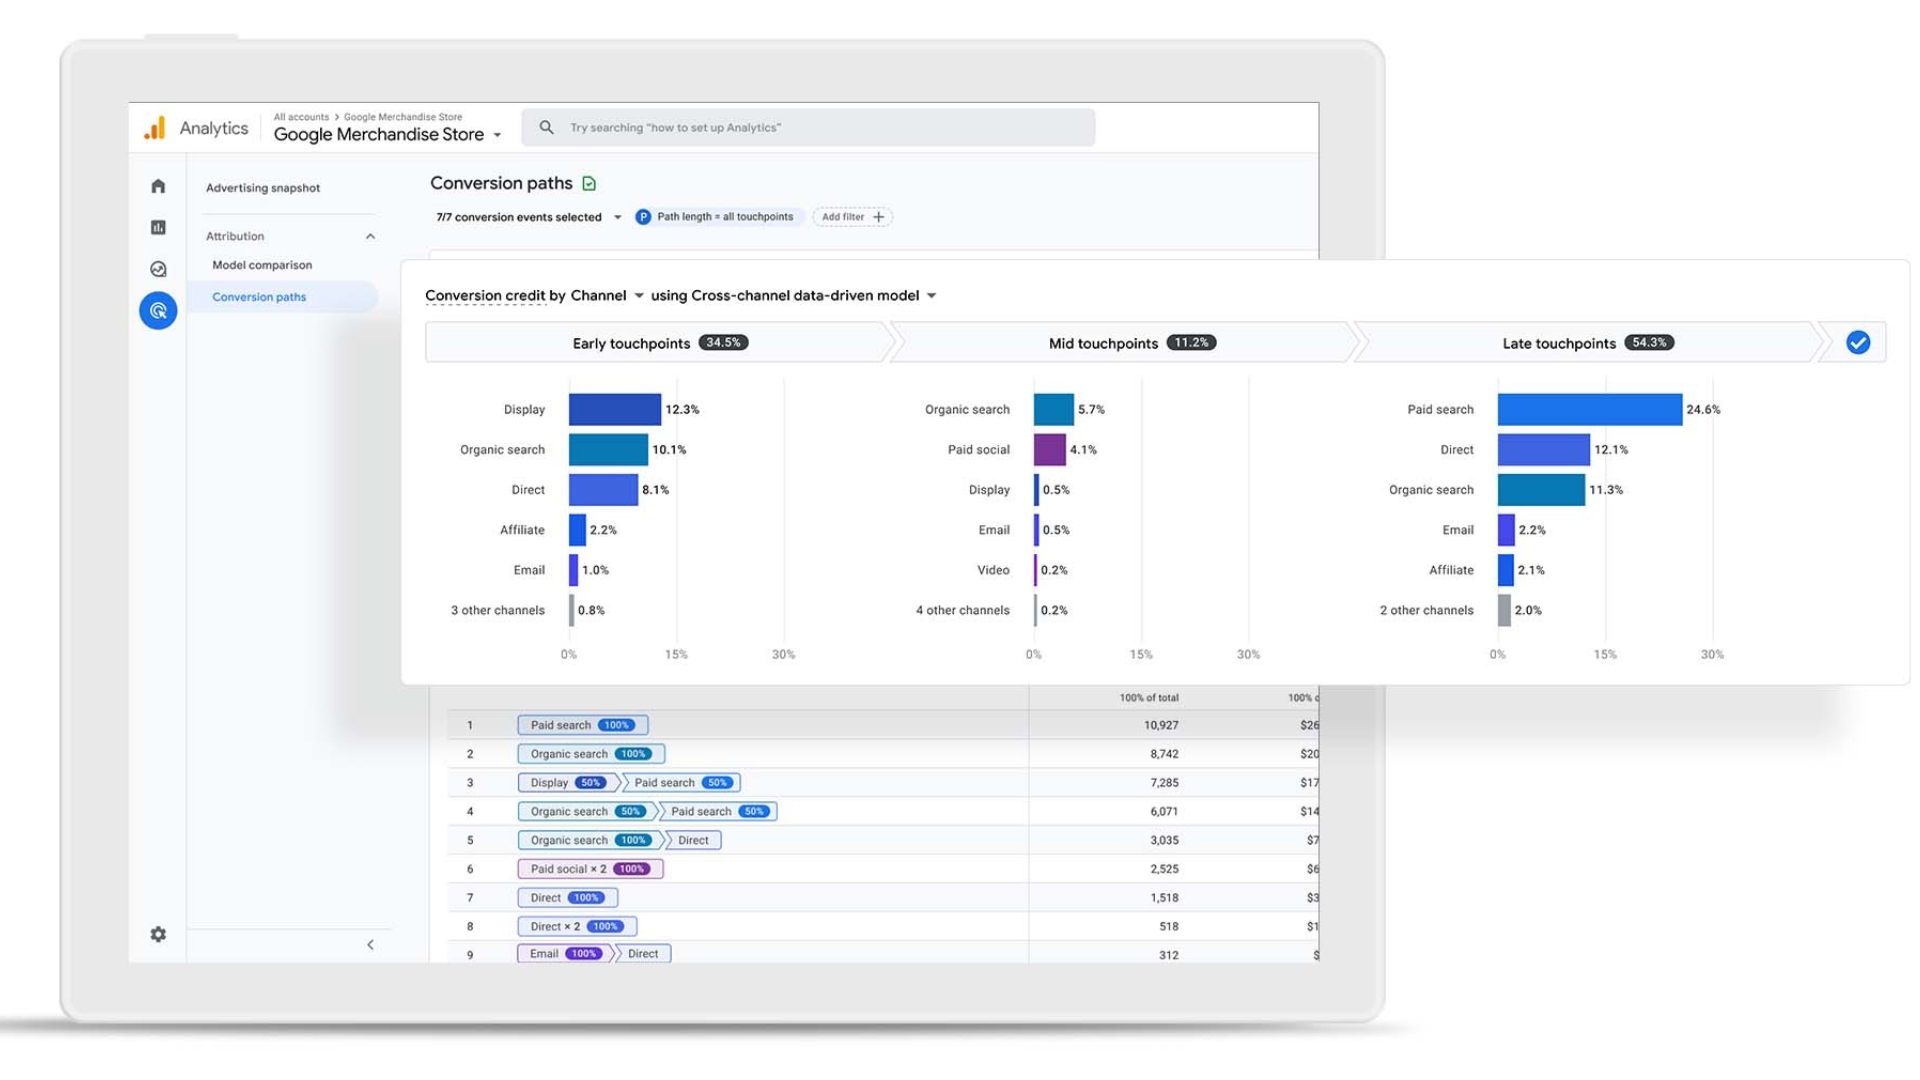
Google Analytics is a tool that tracks everything happening on your website. It tells you:
- How many people visit your site
- Where your visitors come from
- What pages do they view most
- How long do they stay
- Whether they make a purchase or fill out a form
If you run a business or blog, Analytics helps you make smarter decisions. You’ll see what’s working, where people drop off, and how to improve your site to grow faster.
Step 2: Set Up a Google Analytics Account
Go to analytics.google.com and sign in with your Google account.
- Click Start Measuring.
- Add your account name (you can use your business name).
- Create a property. Enter your website name, time zone, and currency.
- Add your website URL and select your industry.
- Choose Web as your platform type.
Once you finish, Google will generate a Measurement ID (something like G-XXXXXXX). This is your tracking code that connects your site to Google Analytics.
Step 3: Install the Tracking Code on Your Website
You have two main options for installing the tracking code.
Option 1: Add it manually
Copy the tracking code from Google Analytics and paste it into your website’s header section before the closing </head> tag.
Option 2: Use a plugin or integration
If you’re using platforms like WordPress, Shopify, or Wix, you can connect Google Analytics through their built-in settings.
- WordPress: Use a plugin like “GA Google Analytics” or “Site Kit by Google.”
- Shopify: Go to Online Store > Preferences and paste the tracking ID in the Google Analytics field.
- Wix: Go to Marketing Integrations and connect Google Analytics directly.
Once installed, visit your site and check your Real-Time report in Analytics. You should see yourself as an active visitor within minutes.
Step 4: Connect Google Search Console
To understand how people find you through Google search, link Google Search Console to your Analytics account.
- Go to Admin > Product Links > Search Console Links.
- Click Link, choose your site, and confirm the connection.
This helps you see which keywords bring traffic, how often your pages appear in search, and what position they rank in.
Step 5: Understand the Google Analytics Dashboard
Once tracking is live, you’ll start seeing data flow in within 24 hours. Here’s a quick breakdown of what you’ll find inside.
- Reports Snapshot: Your website overview such as users, sessions, average engagement time, and conversions.
- Real-Time Report: See who’s on your site right now, where they came from, and what page they’re on.
- Acquisition: Shows where your traffic comes from like Google, social media, email, or referrals.
- Engagement: Shows what people do once they land on your site. You’ll see your most visited pages and how long users stay.
- Monetization: If you sell products, this report shows your revenue, transactions, and top-performing items.
- Retention: Tells you how often visitors come back after their first visit.
If you’re new, focus on Acquisition and Engagement first. Those tell you where visitors come from and what content keeps them interested.
Step 6: Track Key Metrics That Matter
There’s a lot of data inside Google Analytics, but you only need a few key metrics to start.
1. Total Users
How many people visited your website during a specific time?
2. Sessions
The number of visits (one person can create multiple sessions).
3. Average Engagement Time
How long do people spend on your site before leaving?
4. Bounce Rate
The percentage of visitors who leave without clicking anything else. A lower bounce rate usually means your content is engaging.
5. Traffic Sources
Where your visitors come from, such as search engines, social media, direct visits, or referrals.
6. Conversions
If you set up goals like purchases or signups, this shows how many people completed them.
Knowing these numbers helps you measure your marketing campaigns, improve content, and make smarter business decisions.
Step 7: Set Up Goals and Conversions
If you want to measure more than traffic, set up conversions to track key actions on your site.
Here’s how to do it:
- Go to Admin > Events > Create Event.
- Add a new event for something like “Form Submission” or “Purchase.”
- Turn it into a conversion by toggling Mark as Conversion on.
Now you’ll know exactly how many people take action, not just how many visit.
For example:
- Goal 1: Completed contact form
- Goal 2: Newsletter signup
- Goal 3: Purchase checkout
This data helps you focus on what drives results, not just page views.
Step 8: Use Google Analytics Reports to Improve
Once you start collecting data, it’s time to act on it.
- If most of your traffic comes from mobile, optimize your site for smaller screens.
- If visitors drop off after viewing one page, make your calls to action clearer.
- If a certain blog post drives most traffic, write more content on that topic.
Analytics shows you where to focus. Over time, you’ll learn which efforts grow your traffic and which don’t.
Step 9: Create Custom Reports and Dashboards
You can build custom dashboards to focus only on what matters to your business.
To create one:
- Go to Explore in the left sidebar.
- Click Blank.
- Add metrics like sessions, users, conversions, and sources.
- Save your report to check weekly.
This helps you avoid getting lost in data and keeps your focus on performance trends that move the needle.
Step 10: Review Your Analytics Weekly
Consistency is key. Make it a habit to check your analytics once a week.
Ask yourself:
- Did traffic increase or decrease?
- What pages performed best?
- Where did most of my visitors come from?
- Which campaigns brought real conversions?
By regularly reviewing your numbers, you’ll understand your audience better and make small improvements that compound over time.
Final Thoughts
Google Analytics might look complicated at first, but once you learn the basics, it becomes one of your most valuable business tools. It helps you understand where your audience comes from, what they want, and how to keep them coming back.
Start simple. Track your visitors, see which pages perform best, and set one or two goals. Over time, you’ll gain insights that help you grow faster with less guesswork. If you haven’t set it up yet, now’s the time. It’s free, powerful, and built to help you make smarter marketing decisions every single day.